dibandingkan Rp193,08 miliar pada tahun sebelumnya.
Kondisi ini disebabkan hampir telah selesainya dari
proyek
high voltage.
Arus Kas dari Aktivitas Pendanaan
Arus kas bersih Perseroan yang diperoleh dari/
dipergunakan untuk aktivitas pendanaan tercatat sebesar
Rp403,58miliar di tahun 2019, naik 107,05% dibandingkan
Rp194,92 miliar pada tahun sebelumnya. Kondisi ini
disebabkan dana dari obligasi.
previous year. The condition was caused by the nearly
completion of high voltage project.
Cash Flow from Financing Activities
The company’s net cash flow from/used for financing
activities was recorded at Rp403.58 billion in 2019,
increased by 107.05% compared to Rp194.92 billion in
the previous year which. The condition was caused by
fund from bonds.
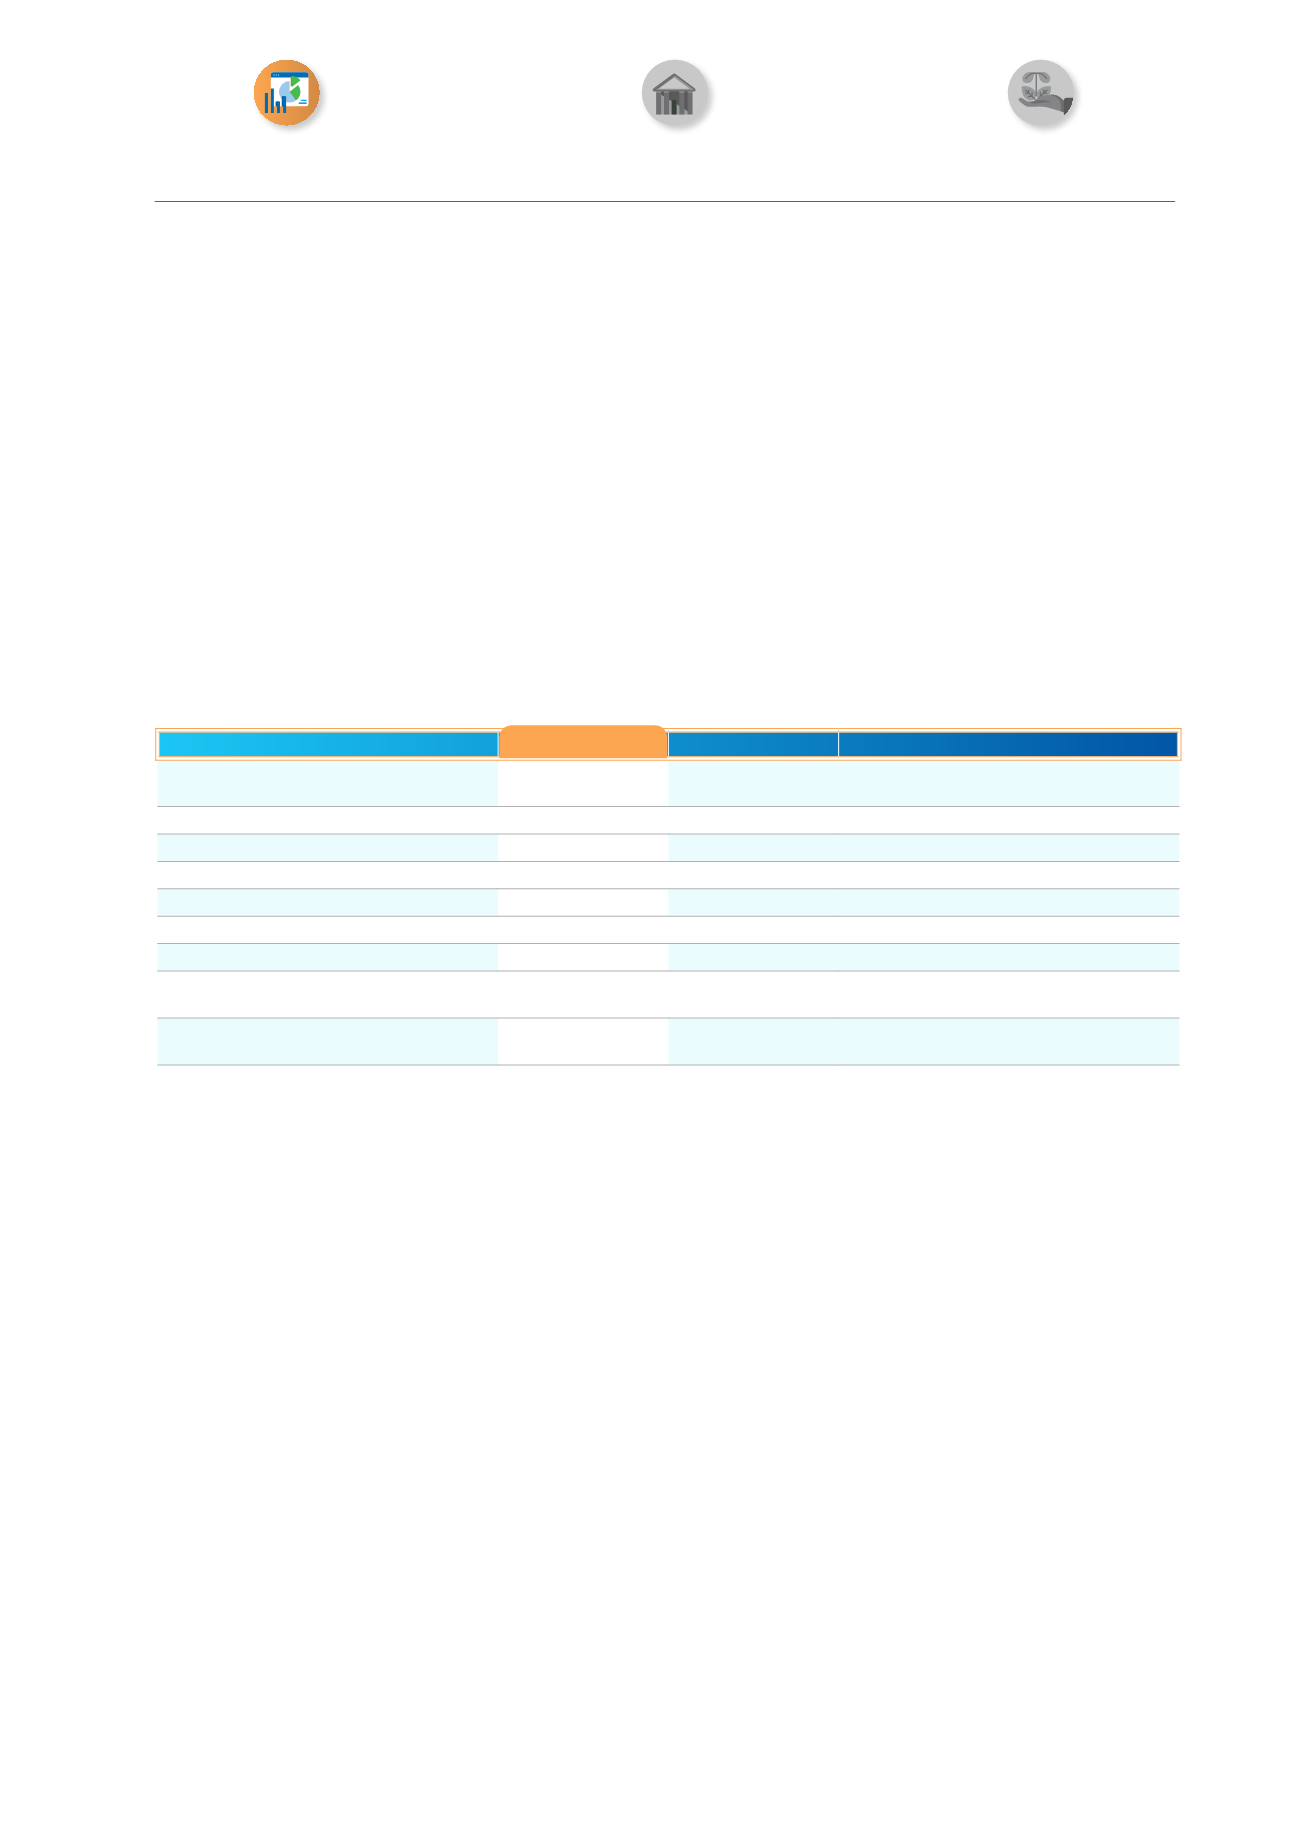
Rasio Keuangan (%)
2019
2018
Financial Ratio (%)
Rasio Laba (Rugi) Bersih terhadap Jumlah
Aset
6,88
4,24
Return of Assets (ROA)
Rasio Laba (Rugi) Bersih terhadap Ekuitas
18,77
11,43
Return of Equity (ROE)
Rasio Lancar
177,53
127,58
Current Ratio
Rasio Liabilitas terhadap Ekuitas
172,88
169,38
Debt to Equity Ratio (DER)
Rasio Liabilitas terhadap Jumlah Aset
63,35
62,88
Debt to Assets Ratio (DAR)
Rasio Ekuitas terhadap Jumlah Aset
36,65
37,12
Equity to Total Assets Ratio
Rasio Laba Kotor terhadap Penjualan Bersih
21,28
16,47
Gross Profit Margin
Rasio Laba (Rugi) Usaha terhadap
Penjualan Bersih
12,56
8,63
Net Operating Profit Margin
Rasio Laba (Rugi) Bersih terhadap
Penjualan Bersih
7,80
3,93
Net Profit Margin
Rasio Keuangan Utama
Key Financial Ratio
Liquidity Ratio is the level of a Company’s ability to meet
all short-term liabilities as measured by the comparison
between current assets and short-term liabilities. In
2019, the Company’s current ratio is 176.47% shows the
value of current assets is bigger by 6.88% times than the
Company current debt.
The solvency ratio shows the ability of the Company
to fulfill all its obligations measured by comparing the
amount of liabilities to total equity and the number of
liabilities to total assets. Equity solvency as of December
31, 2019 is 172.88%, higher compared to 169.38% in the
previous year.
Meanwhile, the collectability of accounts receivable is
used to measure the period of the Company’s accounts
receivable turnover. The receivables collectability in 2019
was 121 days, slower than in 2018 which was 107 days.
Rasio Likuiditas adalah tingkat kemampuan Perseroan
untuk memenuhi seluruh liabilitas jangka pendek yang
diukur dengan perbandingan antara aset lancar dengan
liabilitas jangka pendek. Pada 2019, rasio lancar Perseroan
sebesar 176,47%menunjukkan nilai aset lancar Perseroan
lebih besar 6,88% kali daripada utang lancar Perseroan.
Rasio solvabilitas menunjukkan kemampuan Perseroan
dalammemenuhi seluruhkewajibannya yangdiukur dengan
membandingkan jumlah liabilitas terhadap jumlah ekuitas
dan jumlah liabilitas terhadap jumlah aset. Solvabilitas
ekuitas per 31 Desember 2019 sebesar 172,88%, lebih tinggi
dibandingkan 169,38% pada tahun sebelumnya.
Sementara itu, tingkat kolektibilitas piutang digunakan
untuk mengukur periode waktu perputaran piutang
Perseroan. Kolektibilitas piutang pada 2019 yang dicapai
sebesar 121 hari, lebih lambat dibandingkan tahun 2018
yang tercatat sebesar 107 hari.
Kemampuan Membayar Pinjaman dan Kolektibilitas Piutang
Solvency and Receivables Collectability
PT Voksel Electric Tbk.
2019 Annual Report
65
ANALISA DAN PEMBAHASAN MANAJEMEN
MANAGEMENT DISCUSSION AND ANALYSIS
Tata Kelola Perusahaan
Good Corporate Governance
Tanggung Jawab Sosial Perusahaan
Corporate Social Responsibility


